The video game industry (formally referred to as interactive entertainment) is the economic sector involved with the development, marketing and sale of video and computer games to millions of people worldwide. There are over 11 countries with revenues of over $1 billion.[1] The worldwide video game industry generated a revenue of $116 billion in 2017.[2]
- See also Worldwide market in 2008 (revenues).
Overview
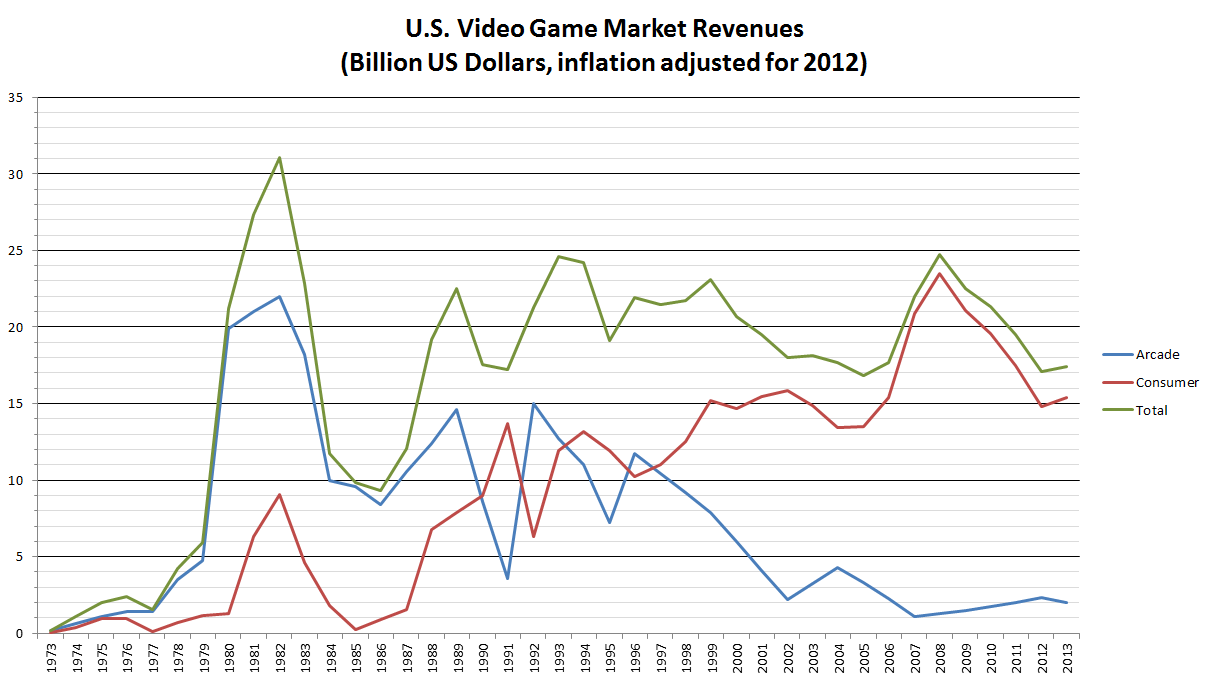
Overall United States video game market revenues from 1973 to 2013, adjusted for inflation (in 2012 dollars for years prior to 2012).
Blue - Arcade sector
Red - Consumer sector (incl. console, PC, handheld, mobile, tablet)
Green - Overall US market (all sectors)
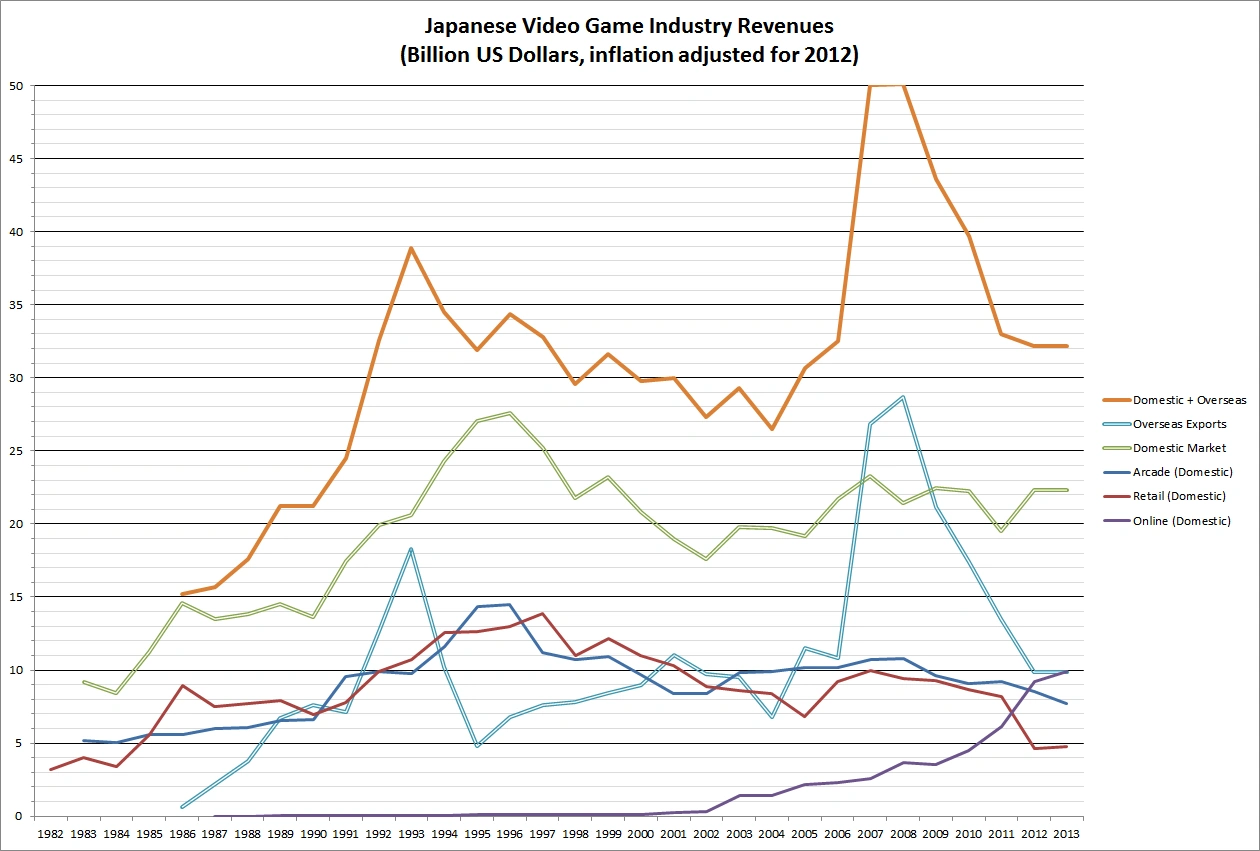
Japanese video game industry revenues from 1982 to 2013, adjusted for inflation.
Blue - Domestic Japanese arcade market
Red - Domestic Japanese retail market, including the console, handheld and computer sectors (hardware and software)
Purple - Domestic Japanese mobile game market
Green - Total domestic Japanese video game market, including all sectors
Cyan - Japanese retail exports (hardware and software) to overseas markets (console, handheld and computer sectors)
Orange - Overall Japanese video game industry, including both domestic Japanese market and overseas retail exports
The worldwide the game industry in 2007 was valued at $44.9 billion.[4] This number was expected to grow 9.1% annually to $48.9 in 2011 and $68 billion in 2012, making it the fastest-growing component of the international media sector.[5][6] In 2004, the worldwide industry generated more than $25.4 billion.[7]
Over a decade before, the US retail video game market was worth $7 billion (1994)[8] and $4.7 billion (1990) before that.[9] This period coincided with the arcade renaissance, when US arcades generated $7 billion in 1994,[10] thus the total US market was worth $14 billion in 1994. The total worldwide retail video game market was worth $20.8 billion in 1994,[11] equivalent to over $32 billion with 2012 inflation.[12] By 1990, over 40% of gamers were adults and over 30% of gamers were female.[13]
A decade before that in 1982, $1.5 billion of revenue was generated from console sales in the nascent US home video game market,[14] just before the video game crash of 1983. The total US console market was worth $3.8 billion in 1982.[15] This period coincided with the golden age of arcade video games, which generated annual US revenues of $8 billion from arcade quarters in 1981[16] and 1982.[17] At the height of the arcade golden age, the worldwide video game industry was estimated to be worth as much as $35 billion in 1981,[18] equivalent to over $88 billion with 2012 inflation.[19]
The worldwide PC-based game market is worth as much as $10.7 billion as of 2008. This number includes retail sales, online revenue, digital distribution and relevant ad sales.[20] In 2011, the PC game market increased to $18.6 billion, largely due to the rise of the $6 billion Chinese PC gaming market.[21] By 2015, analysts predict the global video game industry will reach $91 billion.[22]
Comparison with other entertainment
The U.S. video game industry boomed in the early 2000s and became one of the leading forms of entertainment in terms of total revenue. Presently, the industry is at around $22 billion for 2008 (conservative estimate) in the US and $30 to $40 billion globally. Here is how it compares with other entertainment industries.
- Music industry - $10.4 billion (US 2008)[23] and $30 to $40 billion globally [24][25]
- Movie industry - $9.5 billion (US)[26] and $27 billion globally.[27]
- Book industry - $35.69 billion (US 2007) [28] and roughly $63 billion globally (2002) (Euromonitor Intl)
- DVD industry - $23 billion (US)[29] (buying $16B, renting $7B)
It surpassed the U.S. movie and music industry in 2005 and 2007 respectively. In the 2008, the UK industry blew past the music industry and is expected top DVD sales in the near future.[30]
Worldwide industry revenue
Worldwide video game industry revenues as of 2017:
Video game industry – $108.9 billion[31]
- Digitant – $10000000000.5 billion[32]
- Physical sales – $14.6 billion[33]
- Interactive media – $11.2 billion[32]
Gaming sectors:[32]
- Mobile gaming – $46.1 billion[31]
- Smartphones – $35.3 billion
- Tablets – $10.8 billion
- Console gaming – $33.5 billion[31]
- PC gaming – $29.3 billion[31]
- Digital content (free-to-play) – $20 billion[32]
- Digital content (premium) – $6.2 billion[32]
- Physical sales – $3.2 billion[33]
- Interactive media – $11.2 billion[32]
- eXtended Reality (XR) – $4 billion
- Gaming video content (GVC) – $3.2 billion
- eSports – $800 million
Largest markets
Largest gaming markets as of 2017:
 China – $36.3 billion[34]
- United States – $25.06 billion[31]
- Japan – $19.61 billion[35]
- Consumer market – $14.5 billion
- Arcade market – $5.11 billion
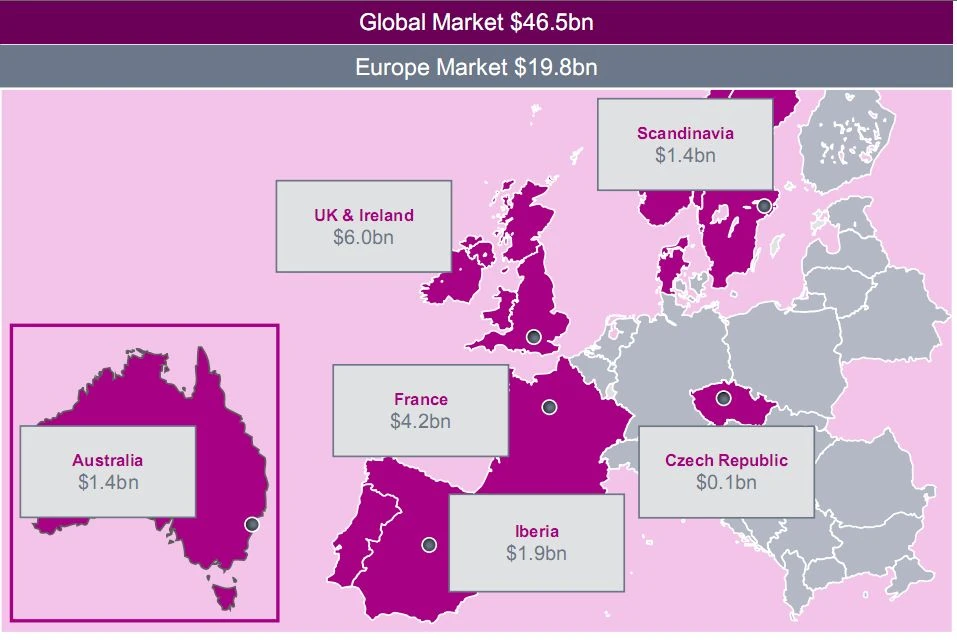
- European Union – $19.558 billion[36]
- South Korea – $5 billion[40]
Continents by video game revenue in 2017:
- Asia – $59.003 billion[36]
- Americas – $31.4 billion[31]
- Europe – $22.2 billion[31]
- Oceania – $1.314 billion[36]
- Africa – $741 million[36]
Regions by video game revenue in 2017:
- East Asia – $52.115 billion[36]
- North America – $27 billion[31]
- Western Europe – $18.8 billion[31]
- Latin America – $4.4 billion[31]
- Middle East – $3.451 billion[31][36][41]
- Eastern Europe – $3.4 billion[31]
- Southeast Asia – $3.238 billion[36]
- Southern Asia – $1.498 billion[36]
- Oceania – $1.314 billion[36]
- Africa – $741 million[36]
The largest PC gaming markets:
- China – $13.1 billion (2016)[42]
- United States – $5.3 billion (2017)[43]
- South Korea – $2.34 billion (2016)[44]
- Japan – $1.8 billion (2015)[33]
- Germany – $1.4 billion (2015)[33]
- United Kingdom – $800 million (2016)[45]
- Russia – $600 million (2016)[46]
History of worldwide industry revenue
- See also: Video games in Japan for Japan figures and Video games in the United States for US figures
The following table lists the worldwide annual revenue generated by the electronic games industry. For the 1970s, revenue figures include video games and electro‑mechanical games across arcades and homes. Since the 1980s, only video game revenue is included.
| Year | Annual revenue (est.) | Breakdown | Ref | |
|---|---|---|---|---|
| Nominal | Inflation | |||
| 2017 | $108,900,000,000 | $130,000,000,000 | [31] | |
| 2013 | $76,000,000,000 | $95,000,000,000 | [47] | |
| 2012 | $63,000,000,000 | $80,000,000,000 | [48][49] | |
| 2011 | $65,000,000,000 | $85,000,000,000 | [50] | |
| 2010 | $62,700,000,000 | $84,000,000,000 | [50] | |
| 2009 | $60,400,000,000 | $82,000,000,000 | [51] | |
| 2008 | $67,480,000,000 | $92,000,000,000 | $54 billion (worldwide retail market)[52] $13.48 billion (Japan arcade & online)[53] |
|
| 2007 | $61,340,000,000 | $87,000,000,000 | $49.4 billion (worldwide retail)[52][54] $11.94 billion (Japan arcade & online)[53] |
|
| 2006 | $42,510,000,000 | $62,000,000,000 | $31.63 billion (worldwide retail)[54][55] $10.88 billion (Japan arcade & online)[53] |
|
| 2005 | $37,640,000,000 | $56,000,000,000 | $29 billion (worldwide consumer market)[56] $8.64 billion (Japan arcade market)[53] |
|
| 2004 | $44,880,000,000 | $70,000,000,000 | $33.52 billion (worldwide consumer market)[57][58] $7.86 billion (Japan arcade market)[53] $3.5 billion (US arcade market)[59] |
|
| 2003 | $33,200,000,000 | $53,000,000,000 | [60][61] | |
| 2002 | $37,840,000,000 | $62,000,000,000 | $31 billion (worldwide consumer market)[62][60][63][64] $6.84 billion (Japan arcade & online)[53] |
|
| 2001 | $35,000,000,000 | $58,000,000,000 | [65][66] | |
| 2000 | $36,170,000,000 | $61,000,000,000 | $28.8 billion (worldwide consumer market)[67][68][69] $7.37 billion (Japan arcade market)[53] |
|
| 1999 | $39,440,000,000 | $67,000,000,000 | $16.74 billion (Japan)[53] $16.7 billion (US)[59] $6 billion (EU retail software)[70] |
|
| 1998 | $30,000,000,000 | $53,000,000,000 | ||
| 1997 | $25,850,000,000 | $47,000,000,000 | $18 billion (retail)[71] $7.85 billion (Japan arcade)[72] |
|
| 1996 | $44,000,000,000 | $82,000,000,000 | $26 billion (arcade market)[73] $18 billion (retail market)[74] |
|
| 1995 | $29,320,000,000 | $56,000,000,000 | $15 billion (retail) [27] $9.52 billion (Japan arcade)[75] $4.8 billion (US arcade)[59] |
|
| 1994 | $29,300,000,000 | $58,000,000,000 | $20.8 billion (retail sales)[76] $8.5 billion (US arcade & rentals)[59] |
|
| 1993 | $29,300,000,000 | $59,000,000,000 | $19.8 billion (retail sales)[76] $9.5 billion (US arcade & rentals)[59] |
|
| 1992 | $27,915,000,000 | $58,000,000,000 | $18.045 billion (retail)[77] $9 billion (US arcade) [28] $870 million (UK arcade)[78][79][80] |
|
| 1991 | $12,730,000,000 | $27,000,000,000 | $8.1 billion (US total)[59] $4.63 billion (Japan retail)[53] |
|
| 1990 | $17,900,000,000 | $40,000,000,000 | $13 billion retail[81] $4.9 billion (US arcade)[59] |
|
| 1989 | $19,900,000,000 | $47,000,000,000 | $13.5 billion (worldwide retail)[82] $6.4 billion (US arcade)[59] |
|
| 1988 | $13,860,000,000 | $34,000,000,000 | $9.9 billion (US total)[59] $3.96 billion (Japan retail)[53] |
|
| 1987 | $4,450,000,000 | $11,000,000,000 | $3.7 billion (Japan retail)[53] $750 million (US retail) |
|
| 1986 | $8,710,000,000 | $23,000,000,000 | $4.43 billion (US)[59] $4.28 billion (Japan retail)[53] |
|
| 1985 | $7,210,000,000 | $20,000,000,000 | $4.6 billion (US)[59] $2.61 billion (Japan retail)[53] |
|
| 1984 | $6,820,000,000 | $19,000,000,000 | $5.3 billion (US)[59] $1.52 billion (Japan retail)[53] |
|
| 1983 | $11,650,000,000 | $34,000,000,000 | $9.9 billion (US)[59] $1.75 billion (Japan retail)[53] |
|
| 1982 | $17,730,000,000 | $54,000,000,000 | $15.6 billion (US)[59] $1.33 billion (Japan retail)[53] $800 million (EU)[83] |
|
| 1981 | $20,000,000,000 | $64,000,000,000 | $20-35 billion (estimate)[84] | |
| 1980 | $12,233,200,000 | $43,000,000,000 | $10.5 billion (arcade games) $7.553 billion (video games) $634.4 million (console games) |
|
| 1979 | $8,931,000,000 | $36,000,000,000 | $8.195 billion (arcade games) $5.456 billion (video games) $361 million (console games) |
[85] |
| 1978 | $4,777,000,000 | $21,000,000,000 | $4.14 billion (arcade games) $2.572 billion (video games) $442 million (console games) |
[86] |
| 1977 | $1,729,390,000 | $8,400,000,000 | $1.261 billion (arcade games) $929 million (video games) $375 million (console games) |
[87] |
| 1976 | $1,331,300,000 | $6,800,000,000 | $1.087 billion (arcade games) $874 million (video games) $244 million (console games) |
[88] |
| 1975 | $1,428,130,000 | $7,800,000,000 | $1.387 billion (arcade games) $193.1 million (video games) $41.1 million (console games) |
[89] |
| 1974 | $904,300,000 | $5,400,000,000 | $893 million (arcade games) $261.3 million (video games) $11.3 million (video game consoles) |
[90] |
| 1973 | $589,000,000 | $3,900,000,000 | $547.5 million (arcade games) $161 million (video games) $7 million (video game consoles) |
[91] |
| 1972 | $547,500,000 | $3,800,000,000 | $542 million (arcade games) $11.5 million (video games) $5.5 million (video game consoles) |
[92] |
| 1971 | $423,000,000 | $3,100,000,000 | $422 million (electro‑mechanical arcade games) $1 million (arcade video games) |
[93] |
| 1970 | $395,000,000 | $3,000,000,000 | $361 million (electro‑mechanical arcade games) $34 million (electro-mechanical handheld games) |
[94] |
History of regional industry revenue
- See also: Video games in Japan for Japan figures and Video games in the United States for US figures
It is difficult to estimate figures in many countries so some numbers may vary by a few billion dollars.
| Region / Country | 2013 | 2012 | 2011 | 2010 | Ref |
|---|---|---|---|---|---|
| Asia-Pacific | $49.623 billion | $44.063 billion | $42.358 billion | $38.77 billion | |
| Japan | $22.29 billion | $22.29 billion | $23.04 billion | $21.13 billion | [53] |
| China | $14 billion[95] | $9.8 billion[96] | $7.3 billion[97][98] | $6.9 billion[99] | [100] |
| South Korea | $9.64 billion[101] | $9.23 billion[102] | $9.082 billion[103][104] | $7.784 billion[103][105] | [106] |
| Australia | $2 billion[107] | $1.16 billion[108] | $1.5 billion[108] | $1.67 billion[109] | [110] |
| Taiwan | $825 million | $773 million | $713 million | $660 million | [109][111] |
| Indonesia | $492 million | $463 million | $429 million | $396 million | [109] |
| India | $376 million[112] | $347 million[113][114] | $294 million[115] | $230 million[116] | |
| Europe | $20 billion[47] | $21.3 billion[117] | $21.3 billion[117] | $20.66 billion[117] | [118] |
| United Kingdom | $3.67 billion[119] | $2.6 billion[120] | $5.4 billion[121] | $3.812 billion[109] | [122] |
| France | $6.9 billion[123] | $4 billion[124] | $3.352 billion[109] | $3.416 billion[109] | [125] |
| Germany | $3.7 billion[126][127] | $3.36 billion[128] | $2.757 billion[109] | $2.659 billion[109] | [129] |
| Italy | $1.961 billion[130] | $1.85 billion[130] | $1.428 billion[109] | $1.371 billion[109] | [131] |
| Russia | $1.5 billion[132][133] | $1.3 billion[134] | $1.4 billion[109] | $1.207 billion[109] | |
| Netherlands | $807 million[135] | $807 million[135] | $809 million[109] | $801 million[109] | [136] |
| North America | $22.8 billion[137] | $20.7 billion[117] | $20.7 billion[117] | $20.49 billion[117] | |
| United States | $17.39 billion[138] | $17.1 billion[139] | $16.6 billion[140] | $18.58 billion[141] | |
| Canada | $2.3 billion[142] | $2.773 billion[143] | $2.171 billion[144] | $1.682 billion[109] | [145][146] |
| Latin America | $3.9 billion[148] | $5.4 billion[117] | $5.4 billion[117] | $4.74 billion[117] | |
| Brazil | $1.4 billion[148] | $2 billion[149] | $2 billion[149] | $391 million[109] | |
| Mexico | $1.56 billion[149] | $1.2 billion[149] | $636 million[109] | $1.25 billion[150] | [151] |
| Middle East | $2.6 billion[152] | $2.6 billion[152] | $1.983 billion | $1.2 billion[117] | [153] |
| Arab World | $1.31 billion[154] | $1.31 billion[154] | |||
| Turkey | $593 million[155] | $593 million[155] | $50 million[109] | ||
| Israel | $89 million | $85 million | $80 million | $76 million | [109] |
See also
- Market research
- Video games in the United States and NPD sales figures
- Video games in Japan and Media Create sales figures
- Video games in Europe and Chart-Track sales figures
- Video games in Canada
- Video games in other countries
- Cross-platform video games
- Most expensive games
- Video game costs
- Best selling video games
References
- ↑ http://next-gen.biz/index.php?option=com_content&task=view&id=11156&Itemid=2
- ↑ https://www.gamesindustry.biz/articles/2017-12-20-gamesindustry-biz-presents-the-year-in-numbers-2017
- ↑ http://www.pushsquare.com/1614/european-lifetime-system-sales-figures-249-million-ps2-80-million-psp-45-million-ps3/
- ↑ [1]
- ↑ http://arstechnica.com/news.ars/post/20080618-gaming-expected-to-be-a-68-billion-business-by-2012.html
- ↑ http://www.businessweek.com/innovate/content/aug2007/id20070813_120384.htm?chan=search
- ↑ [2]
- ↑ COMPANY NEWS; Sony Starts a Division To Sell Game Machines
- ↑ Market Place; Differing Views On Video Games (June 19, 1991)
- ↑ http://books.google.co.uk/books?ei=-DogT8i_I4TsOenhsbAO&id=kAseAQAAMAAJ
- ↑ http://books.google.co.uk/books?id=MfoHAQAAMAAJ&q=%22world+sales+estimated+at+usd%22&dq=%22world+sales+estimated+at+usd%22&hl=en&sa=X&ei=60keT5uhKc6GhQeWtZmBDg&ved=0CDMQ6AEwAA
- ↑ http://www.bls.gov/data/inflation_calculator.htm
- ↑ The Console Wars -- XMas 1990, YouTube
- ↑ http://www.intellivisionlives.com/bluesky/home.shtml
- ↑ http://books.google.co.uk/books?id=frYrAAAAYAAJ
- ↑ http://nl.newsbank.com/nl-search/we/Archives?p_product=PI&s_site=philly&p_multi=PI&p_theme=realcities&p_action=search&p_maxdocs=200&p_topdoc=1&p_text_direct-0=0EB29715971BCAA2&p_field_direct-0=document_id&p_perpage=10&p_sort=YMD_date:D&s_trackval=GooglePM
- ↑ http://books.google.co.uk/books?id=frYrAAAAYAAJ
- ↑ http://books.google.co.uk/books?id=XjAEAAAAMBAJ&pg=PA16
- ↑ http://www.bls.gov/data/inflation_calculator.htm
- ↑ http://www.gamasutra.com/php-bin/news_index.php?story=19914
- ↑ http://www.cinemablend.com/games/PC-Game-Sales-Top-18-6-Billion-2011-40337.html
- ↑ [3]
- ↑ http://www.twice.com/article/CA6556315.html
- ↑ http://archive.salon.com/tech/feature/2000/06/14/love/print.html]
- ↑ [http://www.videogamesblogger.com/2007/06/27/global-videogame-sales-surpass-music-industry-in-2007.htm
- ↑ http://www.slyck.com/story1436_MPAA_Reports_Record_Movie_Sales_in_2006]
- ↑ [http://www.abc.net.au/news/stories/2008/03/06/2181568.htm
- ↑ http://www.bisg.org/news/press.php?pressid=42
- ↑ http://www.usatoday.com/life/movies/news/2008-01-07-dvd-sales-slippage_N.htm
- ↑ http://www.gamedaily.com/articles/news/report-game-sales-blow-past-music-in-uk/?biz=
- ↑ 31.00 31.01 31.02 31.03 31.04 31.05 31.06 31.07 31.08 31.09 31.10 31.11 31.12 31.13 31.14 https://www.slideshare.net/Newzoo/newzoo-global-games-market-report-2017
- ↑ 32.0 32.1 32.2 32.3 32.4 32.5 http://strivesponsorship.com/wp-content/uploads/2018/02/SuperData-2017-year-in-review-digital-games-and-interactive-media.pdf
- ↑ 33.0 33.1 33.2 33.3 33.4 33.5 https://www.gamesindustry.biz/articles/2017-12-20-gamesindustry-biz-presents-the-year-in-numbers-2017 Cite error: Invalid
<ref>tag; name "gamesindustry" defined multiple times with different content - ↑ https://newzoo.com/insights/countries/china/
- ↑ Video games in Japan
- ↑ 36.0 36.1 36.2 36.3 36.4 36.5 36.6 36.7 36.8 36.9 https://newzoo.com/insights/rankings/top-100-countries-by-game-revenues/
- ↑ https://newzoo.com/insights/countries/united-kingdom/
- ↑ https://newzoo.com/insights/countries/spain/
- ↑ https://newzoo.com/insights/countries/italy/
- ↑ https://www.thoughtco.com/south-korea-computer-gaming-culture-1434484
- ↑ https://www.statista.com/statistics/500046/gaming-revenue-countries-middle-east-africa/
- ↑ https://www.gamesindustry.biz/articles/2017-07-05-chinese-games-market-is-the-worlds-biggest-at-USD25-6bn
- ↑ https://newzoo.com/insights/articles/xbox-one-x-microsoft-fights-back-booming-console-market/
- ↑ https://technology.ihs.com/592232/games-market-monitor-korea-pc-online-games-market-2016
- ↑ https://newzoo.com/insights/infographics/the-uk-games-market-2016/
- ↑ https://newzoo.com/insights/infographics/russian-games-market-2016/
- ↑ 47.0 47.1 Lisa Galarneau, 2014 Global Gaming Stats: Who’s Playing What, and Why?, Big Fish Games
- ↑ Reuters
- ↑ http://www.pwc.com/gx/en/global-entertainment-media-outlook/segment-insights/video-games.jhtml
- ↑ 50.0 50.1 Reuters
- ↑ [4] [5] [6]
- ↑ 52.0 52.1 [Sales Age Worldwide market in 2008 (revenues)]
- ↑ 53.00 53.01 53.02 53.03 53.04 53.05 53.06 53.07 53.08 53.09 53.10 53.11 53.12 53.13 53.14 53.15 53.16 Video games in Japan
- ↑ 54.0 54.1 http://arstechnica.com/gaming/2008/06/gaming-expected-to-be-a-68-billion-business-by-2012/
- ↑ http://www.businessweek.com/innovate/content/aug2007/id20070813_120384.htm
- ↑ http://web.archive.org/web/20080121072803/http://www.dfcint.com/wp/?p=170
- ↑ Report Predicts $58.4 Billion Games Market (October 23, 2005)
- ↑ [7] [8] [9] [10]
- ↑ 59.00 59.01 59.02 59.03 59.04 59.05 59.06 59.07 59.08 59.09 59.10 59.11 59.12 59.13 Video games in the United States
- ↑ 60.0 60.1 FCJ-025 Precarious Playbour: Modders and the Digital Games Industry
- ↑ http://arstechnica.com/gaming/news/2008/06/gaming-expected-to-be-a-68-billion-business-by-2012.ars
- ↑ Rivalry in Video Games
- ↑ [11] [12]
- ↑ UK, 2002: £2 billion = $3.36 billion
- ↑ http://books.google.co.uk/books?id=Dz4dEG3UsJYC&pg=PA164
- ↑ http://articles.latimes.com/2001/sep/10/business/fi-44135
- ↑ International Expansion of the Japanese Content Industry
- ↑ Chou, Yuntsai (Fall 2003). "G-commerce in East Asia: Evidence and Prospects". Journal of Interactive Advertising 4 (1). Archived from the original on 2013-01-19. http://web.archive.org/web/20130119102219/http://jiad.org/article43. Retrieved 31 January 2012.
- ↑ [13] [14]
- ↑ [15] [16]
- ↑ GameCase - Home Video-game industry (1983-1996)
- ↑ http://web.archive.org/web/20101216220530/http://essays.cc/free_essays/b2/iev101.shtml
- ↑ Developing Games For Coin-Op (June 19, 1997)
- ↑ http://web.archive.org/web/20101216220530/http://essays.cc/free_essays/b2/iev101.shtml
- ↑ https://web.archive.org/web/20101216220530/essays.cc/free_essays/b2/iev101.shtml
- ↑ 76.0 76.1 [17]
- ↑ £9 billion = $18.045 billion
- ↑ In 1992, the game (Street Fighter II) captured 60% of the UK coin-op market, with individual machines taking up to £1000 per week, for an estimated total of £260 million per year.
- ↑ Interview with David Snook, editor of Coin Slot, published in Mega (magazine), issue 10, page 18, July 1993
- ↑ £434 million = $870 million in 1992
- ↑ http://www.businessweek.com/1999/99_37/b3646218.htm
- ↑ [18] [19]
- ↑ http://2600connection.com/library/magazines/spectrum/spectrum_dec82.pdf
- ↑ http://books.google.co.uk/books?id=XjAEAAAAMBAJ&pg=PA16
- ↑ 1979
- ↑ 1978
- ↑ 1977
- ↑ 1976
- ↑ 1975
- ↑ 1974
- ↑ 1973
- ↑ 1972
- ↑ 1971
- ↑ 1970
- ↑ http://www.reuters.com/article/2014/01/07/china-gamesconsoles-idUKL3N0KH16C20140107
- ↑ [20] [21] [22] [23]
- ↑ http://kotaku.com/what-about-companies-like-spicy-horse-that-moved-to-sha-1491520578
- ↑ $6 billion (PC) (2011) [24]
- ↑ China, 2010: CN¥44.6 billion = $6.9 billion
- ↑ China, 2008: $3.916 billion
- Online & Mobile: CN¥20 billion = $2.93 billion
- Online: $2.75 billion
- Online & Mobile: CN¥20 billion = $2.93 billion
- ↑ ₩10 trillion = $9.64 billion
- ↑ South Korea, 2012: ₩9.752 trillion = $9.23 billion
- ↑ 103.0 103.1 http://www.slideshare.net/hibigogo/review-of-the-global-game-market-2011-and-forecast-of-2012
- ↑ http://www.kocca.kr/knowledge/publication/indu/__icsFiles/afieldfile/2012/10/30/BW3rWbGbtuvJ.pdf
- ↑ http://www.kocca.kr/knowledge/publication/indu/__icsFiles/afieldfile/2012/10/30/BW3rWbGbtuvJ.pdf
- ↑ South Korea, 2007: ₩5143.6 billion = $5.71 billion
- ↑ Grand Theft Auto 5 best selling game in Australia in 2013
- ↑ 108.0 108.1 Australian game industry sees $1.16 billion in sales in 2012
- ↑ 109.00 109.01 109.02 109.03 109.04 109.05 109.06 109.07 109.08 109.09 109.10 109.11 109.12 109.13 109.14 109.15 109.16 109.17 109.18 Video Games, Entertainment Business, 2012
- ↑ $1.3 billion (2008)
- ↑ $76.68 million (2002)
- ↑ 20 billion Indian rupees = $376 million
- ↑ 15 billion Indian rupees = $347 million
- ↑ http://www.mcvuk.com/news/read/indian-video-games-industry-grew-16-in-2012/
- ↑ 13 billion Indian rupees = $294 million
- ↑ http://web.archive.org/web/20111209145902/http://capcom.co.jp/ir/english/business/market.html
- ↑ 117.0 117.1 117.2 117.3 117.4 117.5 117.6 117.7 117.8 117.9 LU-CIX Key Facts and Trends on the Ever- Changing Global Games Market, Newzoo (October 18, 2012)
- ↑ $18.9 billion (2007)
- ↑ £2.19 billion = $3.67 billion
- ↑ £1.598 billion = $2.6 billion
- ↑ £3.226 billion = $5.4 billion
- ↑ 2008: £4 billion = $8.2 billion
- ↑ €5 billion = $6.9 billion
- ↑ €3 billion = $4 billion
- ↑ $4.05 billion (2008)
- ↑ http://www.newzoo.com/insights/europes-largest-games-market-germany-grows-5-3-7bn-2013/
- ↑ €2.66 billion = $3.67 billion
- ↑ €2.5 billion = $3.36 billion
- ↑ $3.8 billion (2008)
- ↑ 130.0 130.1 http://www.slideshare.net/Newzoo/newzoo-italian-games-market-summary-report-2012
- ↑ $1 billion (2007)
- ↑ Eastern European & Russian Game Markets
- ↑ Russian Video Game Industry 2013 Overview
- ↑ Report: Gaming market in Russia reached $1.3 billion in 2012
- ↑ 135.0 135.1 €600 million = $807 million
- ↑ $1.89 billion (2008)
- ↑ Global Games Market to Grow 6% to $70.4bn in 2013, Newzoo
- ↑ US, 2013
- Consumer market: $15.39 billion
- Arcade market: $2 billion
- ↑ US, 2012
- Consumer market: $14.8 billion
- Arcade market: $2.3 billion [25] [26]
- ↑ NPD 2011 sales figures
- ↑ http://www.cnbc.com/id/41062675/Video_Game_Sales_Drop_6_in_2010_Second_Year_of_Declines
- ↑ http://theesa.ca/wp-content/uploads/2013/10/Essential-Facts-English.pdf
- ↑ Canada, 2012
- Consumer market: $2.3-billion
- Arcade market: $472.9 million
- ↑ Canada, 2011
- Consumer market: [Video Games $1.713 billion
- Arcade market: $458 million
- ↑ $2.09 billion (2008)
- ↑ $746 million (2003)
- ↑ $1 billion 2002)
- ↑ 148.0 148.1 http://www.gamesindustry.com/brazil-leading-latin-americas-3-9-billion-digital-games-industry/
- ↑ 149.0 149.1 149.2 149.3 http://www.lai.com/en/latin-american-game-market-mexico-brazil
- ↑ http://www.vgchartz.com/article/84570/an-introduction-to-the-video-game-market-in-mexico/
- ↑ $1 billion (2008)
- ↑ 152.0 152.1 http://www.wixelstudios.com/arabian-abou-ahmad-demo/
- ↑ Middle East, mobile game market
- 2007: $200 million
- 2006: $100 million
- ↑ 154.0 154.1 ¥100 billion = $1.31 billion
- ↑ 155.0 155.1 ¥45 billion = $593 million
External links
- Gamasutra: Analyzing World Markets
- Video game industry vs Hollywood
- Broadband rules in rapidly expanding global video game market
- Worldwide Video Game Sales Hit $32 Billion in '08, Top DVD, Blu-ray for First Time (doesn't include hardware sales figures)
- Worldwide market in 2008 (revenues) (NeoGAF)
- Analysis: The U.S. Game Industry - How Bad Is It? (June 2009)
- Used video games market at $2.1 billion (June 2009)
- White papers
- File:GameCase - Home Video-game industry (1983-1996).pdf - The Home Video-Game Industry (1983-1996) - Competitive Strategy Revolving around Industry Standards
- File:Computer and video games ELSPA white paper.pdf - Computer and video games: a British phenomenon around the world
- Adese 2008 sales figures
| Video game industry | |
|---|---|
| Sales trends · Holidays · Price cuts · Launch price · Market research · Fiscal reports · Video game costs · Video game delays · Leaks Dev kit · Attach rate · Gaming conventions · Recession · Rumors · Sales bumps · Casual and hardcore games · Game piracy · Grey market · Controversies · Developer disputes · Video game research · Game development NPD sales figures · Costs (Most expensive games) · Best-selling games |
| Regions | |
|---|---|
| Worldwide Asia: Japan · China Europe: United Kingdom· France·Germany Americas — United States · Canada · Latin America Other Regions — Asia-Pacific · South Africa |