- See also: NPD sales figures and Seventh generation of video games
NPD sales figures. Lifetime to date United States hardware numbers for Xbox 360, Wii, PlayStation 3. For worldwide sales, see seventh generation of video games
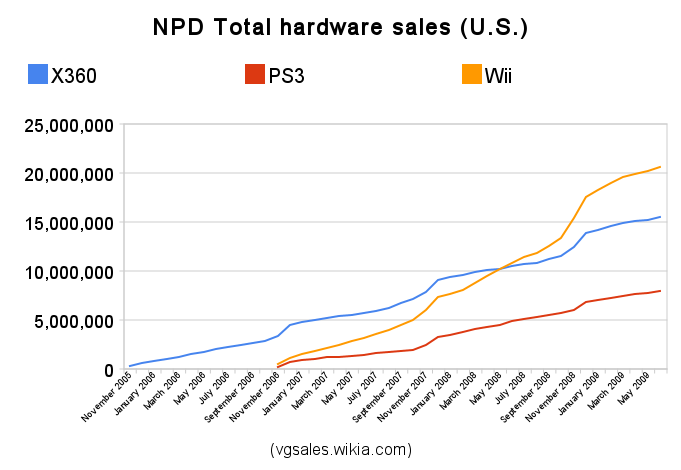
NPD hardware sales
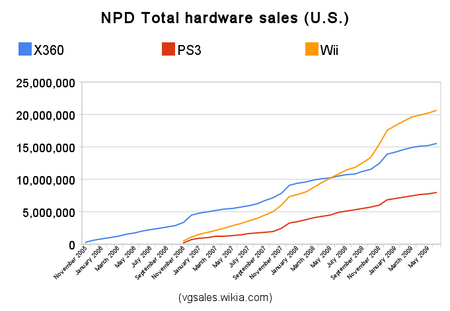
NPD Consoles sales
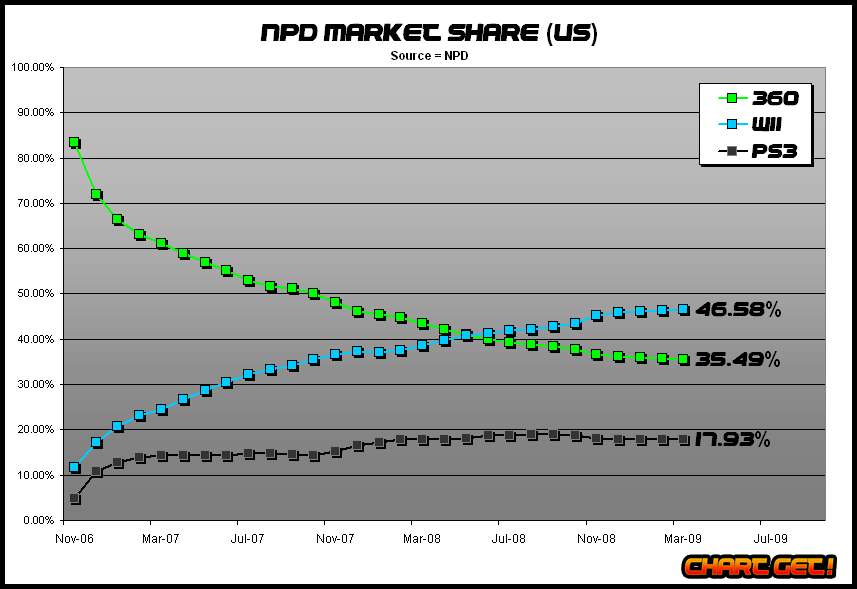

Market share (image courtesty of ChartGet!)
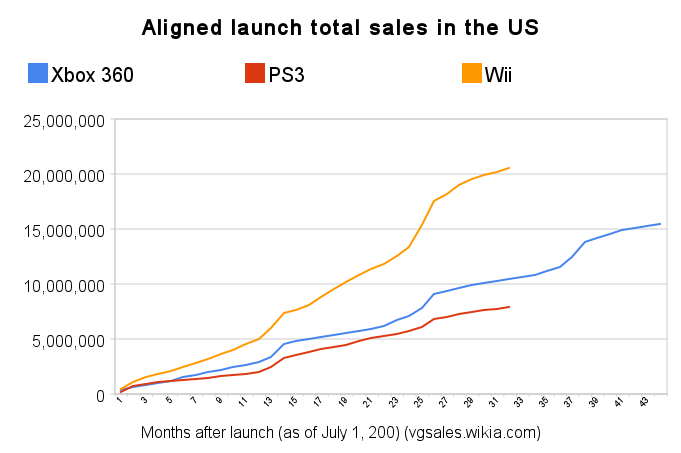
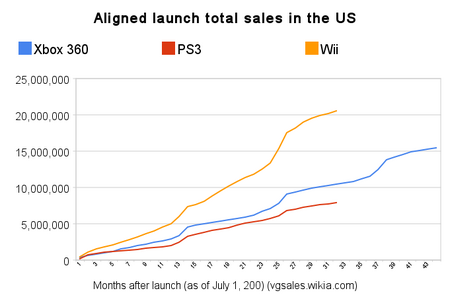
Aligned launch of three consoles (source)

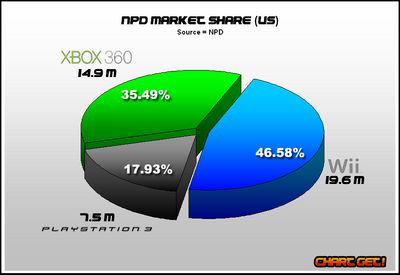
Console market share through April 2009 (courtesy of ChartGet!)
The seventh generation began on November 2005 with the release of the Xbox 360. The Xbox 360 was plagued by severe stock shortages. The gray market was riddled with Xbox 360 selling on Ebay for many months after its release. As a result, it only managed 607,000 in 2005. Microsoft met demand around March 2006.[1]With a one year lead on the other consoles, the Xbox 360 gained a 2,892,000 advantage before the mid-November release of the Wii and PlayStation 3 (worldwide, the advantage was around 10 million). The Wii and PS3 releases were met with great demand. Sony experienced a blue laser diode shortage which led to only ~200,000 units being available at launch.[2] Although supply met demand in January 2007 for the PS3[3], the Wii surprisingly continued with shortages well into 2007. This shortage would continue until 2009, nearly three years after its release.
After the initial launch hype subdued, one of the biggest stories of 2007 was the subpar sales of the PlayStation 3. The high price, uncertainty of the Blu-ray Disc format, and low availability of exclusive video games turned people away from the system. It reached a low point of 82,000 in April and May. Altogether, it sold 1.3 million less in its first full year than the Xbox 360's debut year. Not all was doom and gloom for Sony however. Its PlayStation 2 console was virtually tied with the Xbox 360 in 2007 with nearly 4.5 million units sold. The Xbox 360 had its first price cut in the United States on August 2007, in preparation of Halo 3. The PS3 appeared to do a permananent price cut on its 60GB model, but it later turned out it was only to clear out hardware in preparation for a new 80GB model. The first true price cut was in October 2007 when they sliced $100 off.
In 2008, the PlayStation 3 picked up speed largely due to the new $499 price cut. For the most part of 2008, Sony's system outsold the Xbox 360. The Xbox 360 reclaimed the yearly lead after its own price cut on September 2008 and stellar holiday sales. Both saw huge sales bumps in April with the release of Grand Theft Auto IV. The Wii moved an astounding 700k+ units twice, which is virtually unheard of for a non-holiday month. This was hint of the record-breaking 2 million November month for Wii.
While it seems clear that the Wii will be the United States console leader, second place is still open as of January 2009, although it appears PS3's ~7 million deficit will be hard to overcome. This scenario is in stark contrast to some of the analyst forecasts made by market research firms at the beginning of the generation.
| Console | 2005 | 2006 | 2007 | 2008 | 2009 (as of July 1, 2009) | Total sales (as of July 1, 2009) |
|---|---|---|---|---|---|---|
| Wii | 0 | 1,080,000 | 6,290,000 | 10,151,000 | 3,024,400 | 20,565,400 |
| Xbox 360 | 607,000 | 0 | 4,619,000 | 4,735,400 | 1,620,600 | 15,478,000 |
| PlayStation 3 | 0 | 688,000 | 2,557,600 | 3,544,900 | 1,120,000 | 7,910,000 |
| PlayStation 2 | ? | ? | 3,945,000 | 2,502,300 | 785,900 | 43,646,222 (as of January 2009)[4] |
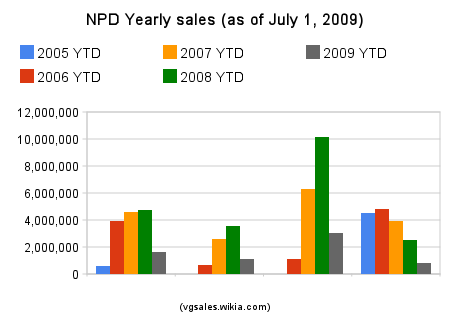
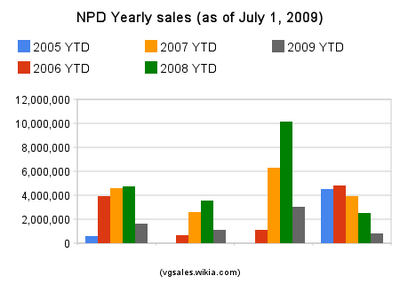
NPD yearly sales figures
| Handheld | 2004 | 2005 | 2006 | 2007 | 2008 | 2009 (as of July 1, 2009) | Total sales (as of NPD Dec 2008) |
|---|---|---|---|---|---|---|---|
| Nintendo DS | ? | ? | ? | 8,430,100 | 9,951,100 | 4,101,800 | 27,514,500 |
| PSP | 0 | ? | ? | 3,763,800 | 3,829,600 | 919,200 | 14,359,500 |
- Main article: NPD sales figures
NPD sales figures monthly table
Month          |    360    |    PS3    |    Wii

November 2005  |   326,000 |           |
December 2005  |   281,000 |           |

January 2006   |   250,000 |           |
February 2006  |   161,000 |           |
March 2006     |   192,000 |           |
April 2006     |   295,000 |           |
May 2006       |   221,000 |           |
June 2006      |   277,000 |           |
July 2006      |   207,000 |           |
August 2006    |   205,000 |           |
September 2006 |   259,000 |           |
October 2006   |   218,000 |           |
November 2006  |   511,000 |   197,000 |   476,000
December 2006  | 1,100,000 |   490,700 |   604,200

January 2007   |   294,000 |   244,000 |   436,000
February 2007  |   228,000 |   127,000 |   335,000
March 2007     |   199,000 |   130,000 |   259,000
April 2007     |   174,000 |    82,000 |   360,000
May 2007       |   155,000 |    82,000 |   338,000
June 2007      |   198,400 |    98,500 |   381,800
July 2007      |   170,000 |   159,000 |   425,000
August 2007    |   276,700 |   130,600 |   403,600
September 2007 |   527,800 |   119,400 |   501,000
October 2007   |   366,000 |   121,000 |   519,000
November 2007  |   770,000 |   466,000 |   981,000
December 2007  | 1,260,000 |   797,600 | 1,350,000

January 2008   |   230,000 |   269,000 |   274,000
February 2008  |   254,600 |   280,800 |   432,000
March 2008     |   262,000 |   257,000 |   721,000
April 2008     |   188,000 |   187,100 |   714,200
May 2008       |   186,600 |   208,700 |   675,100
June 2008      |   219,000 |   405,500 |   666,700
July 2008      |   205,000 |   225,000 |   555,000
August 2008    |   195,200 |   185,400 |   453,000
September 2008 |   347,200 |   232,400 |   687,000
October 2008   |   371,000 |   190,000 |   803,000
November 2008  |   836,000 |   378,000 | 2,040,000
December 2008  | 1,440,000 |   726,000 | 2,150,000

January 2009   |   309,000 |   203,200 |   679,200
February 2009  |   391,000 |   276,000 |   753,000
March 2009     |   330,000 |   218,000 |   601,000
April 2009     |   175,000 |   127,000 |   340,000
May 2009       |   175,000 |   131,100 |   289,500
June 2009      |   240,600 |   164,700 |   361,700
July 2009      |   202,900 |   121,800 |   252,500
August 2009    |   215,400 |   210,000 |   277,400
September 2009 |   352,600 |   491,800 |   462,800
October 2009   |   249,700 |   320,600 |   506,900
November 2009  |   819,500 |   710,400 | 1,260,000
December 2009  | 1,310,000 | 1,360,000 | 3,810,000

January 2010   |   332,800 |   276,900 |   465,800
February 2010  |   422,000 |   360,100 |   397,900
March 2010     |   338,400 |   313,900 |   557,500
April 2010     |   185,400 |   180,800 |   277,200
May 2010       |   194,600 |   154,500 |   334,800
June 2010      |   451,700 |   304,800 |   422,500
July 2010      |   443,500 |   214,500 |   253,900
August 2010    |   356,700 |   226,000 |   244,300
September 2010 |   484,000 |   312,000 |   254,000
October 2010   |   325,000 |   250,000 |   232,000
November 2010  | 1,370,000 |   530,000 | 1,270,000
December 2010  | 1,860,000 | 1,210,000 | 2,360,000

January 2011   |   381,000 |   267,000 |   319,000
February 2011  |   535,200 |   402,600 |   454,900
March 2011     |   433,000 |   365,000 |   290,000
April 2011     |   297,000 |   204,300 |   172,000
May 2011       |   270,000 |   177,000 |   236,000
June 2011      |   507,000 |   276,000 |   273,000
July 2011      |   277,000 |   148,000 |   190,000
August 2011    |   308,000 |   218,000 |   190,000
September 2011 |   483,000 |   374,000 |   240,000
October 2011   |   393,000 |   250,000 |   250,000
November 2011  | 1,700,000 |   901,000 |   860,000
December 2011  | 1,700,000 |   936,000 | 1,060,000

Total          |32,675,500 |19,990,100 |38,739,400
Sales figures
After 18 months[1]:
Software sales
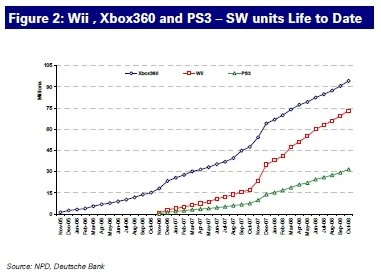
Software sales in the U.S. through October 2008
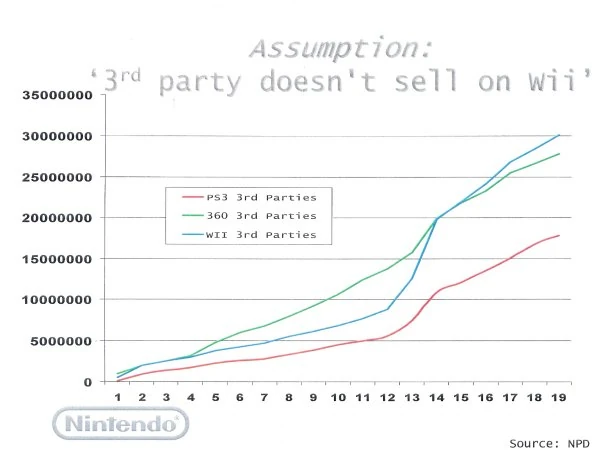
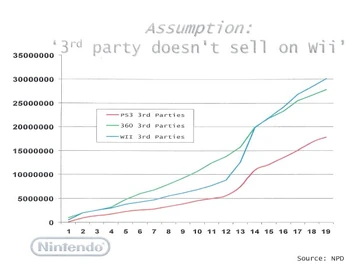
Third party sales from all three consoles with launch aligned
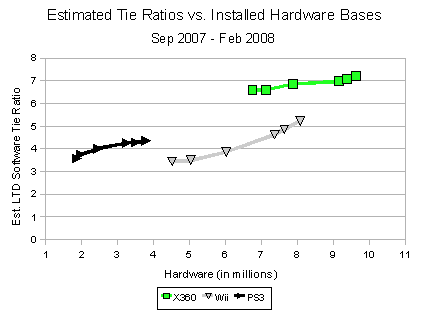
Estimated attach rate
- See also: Best selling games (seventh generation)
Sales for the seventh generation were off the charts. Not only did the industry see two of the biggest releases ever in Halo 3 and Grand Theft Auto IV, but new accessible games like Rock Band and the Wii Series of games were welcomed by new gamers.
In the first 18 months of release, the Wii sold over 50 million games, not including the bundled Wii Sports or Virtual Console games. Not only does this best the sales of this generation's competitors, but it is larger than the extremely successful PlayStation 2, which had 42 million. About 8 million units separated the Xbox 360 and PS3; the former had 28 million while the latter had 20 million.[5]
Xbox 360 leads total software sales as of October 2008. Over 94 million games have been sold for Microsoft's console. Wii and the PS3, released a year later, are at 73 million and 30 million respectively.[6][7] Nintendo's first party efforts like Mario Kart Wii and Wii Fit have dominated the Wii gaming scene, possibly alienating some decent 3rd-party games and causing a third-party software problem. According to NPD sales figures, the Xbox 360 has generated more revenue at retail for third-party publishers than the PS3 and Wii combined this generation, a very remarkable feat.[8]
In addition, the attach rate for the Xbox 360 is at a staggering 8.1 games per console. This is far greater than the 5.5 software tie ratio for Wii and 5.3 for PS3.[9][10]
- Xbox 360
- Halo 3
- Gears of War 1 & 2
- Grand Theft Auto IV
- Call of Duty 4 and World at War
- Rock Band
- Wii
- Wii Sports
- Wii Play
- Wii Fit
- Mario Kart Wii
- Super Smash Bros. Brawl
- Guitar Hero
- PlayStation 3
- Metal Gear Solid 4
- Resistance
- Grand Theft Auto IV
- Uncharted
See also
Charts
")
")
.png "Npd total sales (aligned launch).png (22 KB)")
")
")
")
")
")
")
")
")
")
.jpg)
")
References
- ↑ http://www.nforcershq.com/analyst-says-xbox-360-supply-problems-easing/
- ↑ http://www.gamedaily.com/articles/news/jack-tretton-ps3-launch-was-our-biggest-disappointment-in-year-one/18724/
- ↑ http://www.techspot.com/news/23930-playstation-3-supply-slowly-meeting-demand.html
- ↑ http://www.neogaf.com/forum/showthread.php?t=349076&page=26 (Anihawk)
- ↑ http://kotaku.com/5010214/nintendo-wii-has-highest-software-sales-for-first-18-months
- ↑ http://www.mcvuk.com/news/32372/US-Wii-install-base-races-ahead-of-360
- ↑ http://www.gamedaily.com/articles/news/wii-us-installed-base-now-leads-xbox-360-by-almost-2-million/?biz=1
- ↑ http://www.thebitbag.com/2008/12/11/microsoft-responds-to-npd-results-2/
- ↑ http://www.gamasutra.com/php-bin/news_index.php?story=21504
- ↑ http://www.gamasutra.com/view/feature/3820/npd_behind_the_numbers_september_.php?page=4
External links
- Exclusive: Sony PSP Versus Nintendo DS - The Sales Showdown
- The Most Rented Games of 2008 Revealed, Xbox 360 Doubles Wii Rentals
- Sony: First-party games 'more important' this generation
| Best selling video games | |
|---|---|
| List of best-selling video games · List of highest-grossing video games
Franchises · United States (NPD) · Japan · Best selling new IPs |