- See also: Seventh generation of video games and NPD Seventh generation
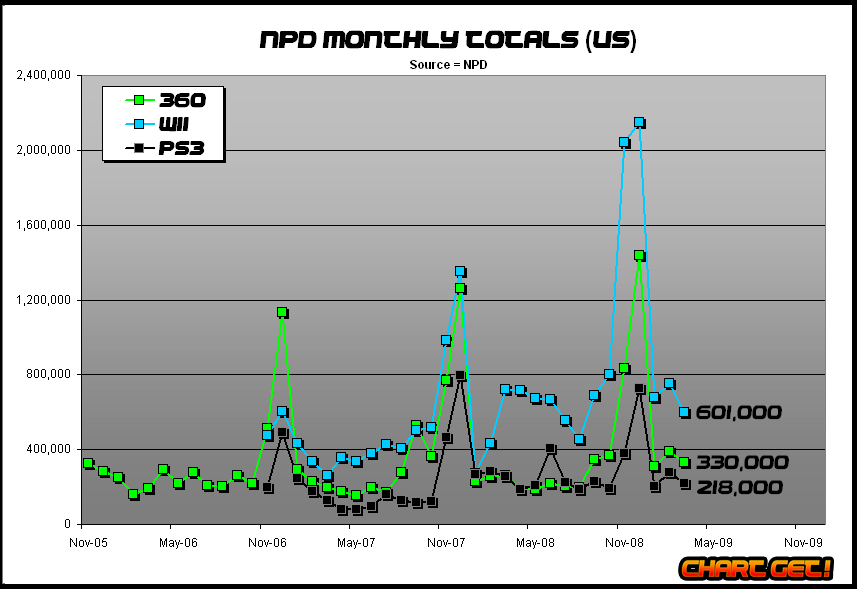
NPD sales figures for the United States in the video game industry.
Note: March, June, September, and December are always five weeks of tracking, while the rest are 4 weeks. NPD does 4-4-5 (weeks/month) quarters, so that year on year quarterly comparisons are valid.
For NPD Charts, go to the bottom of this page.
See also
- Media Create sales data for Japan sales figures,
- Chart-Track sales data for Europe sales figures,
- Best selling games for worldwide sales figures.
Lifetime sales and records
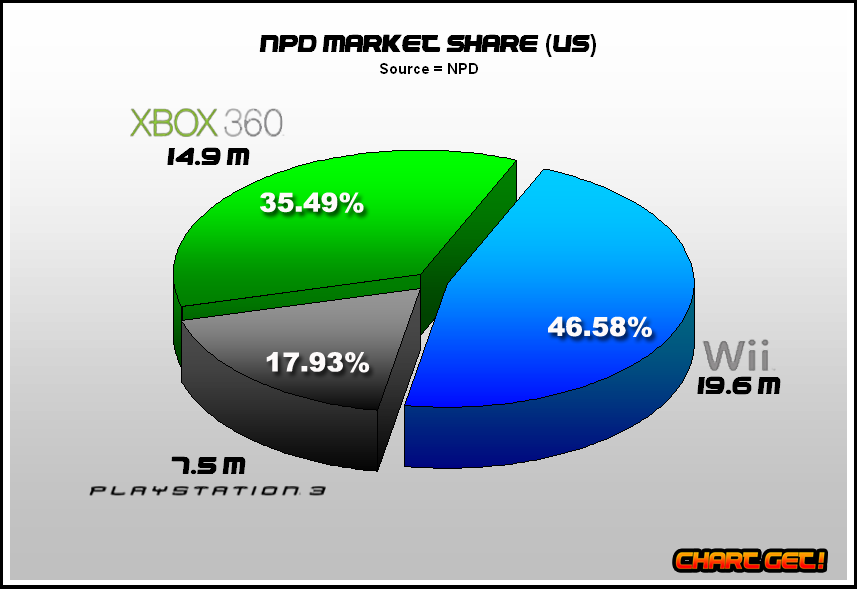
NPD Seventh generation market share (as of April 2009)
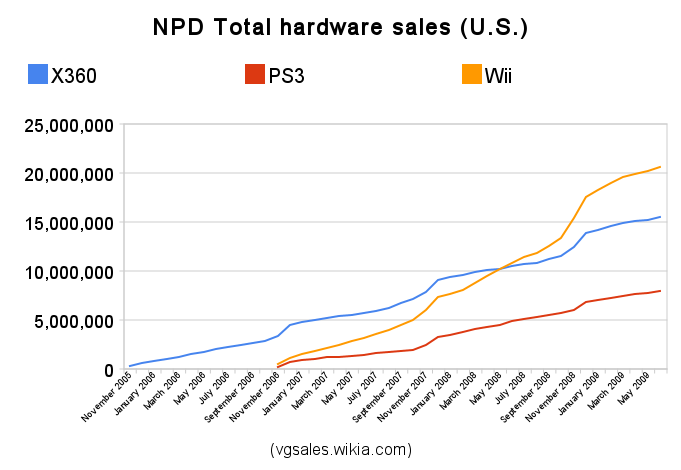
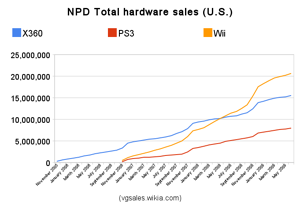
Seventh generation console sales (as of October NPD 2008)
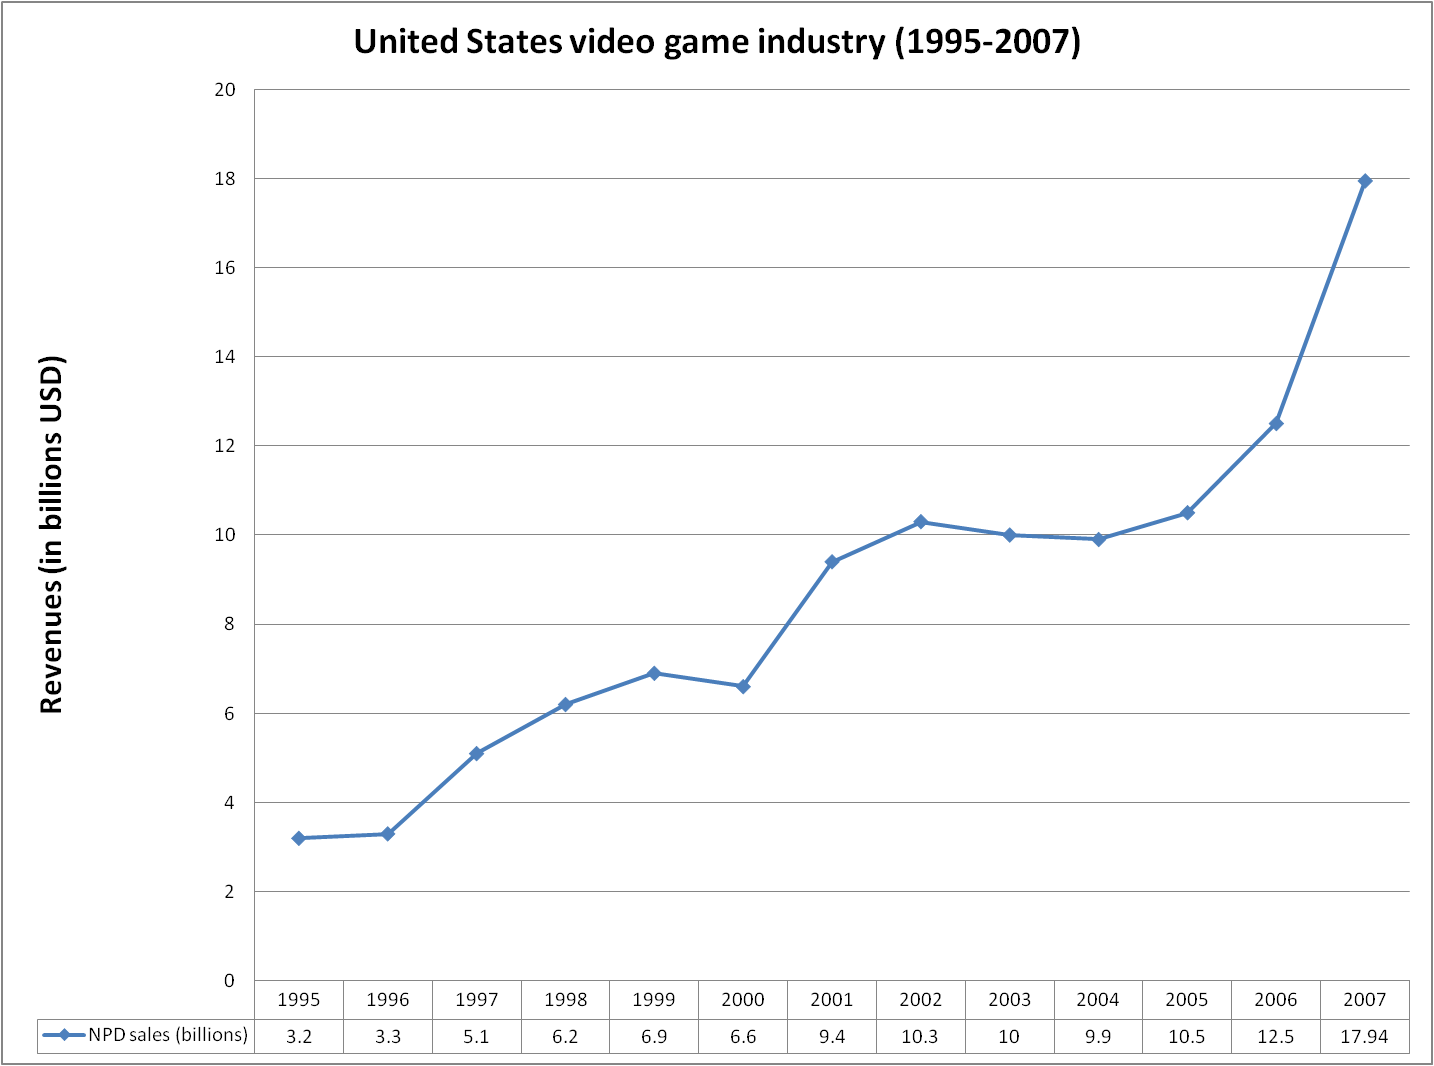
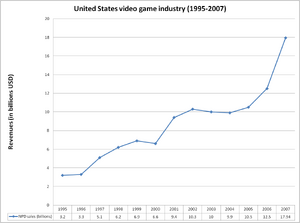
United States video game revenues (1995-2007), without inflation, for console games (not including arcade or PC).
- NPD Console sales
- NPD Fastest selling video games
- NPD Best selling video games of all-time
- NPD records and milestones
2021
2020
2019
2018
2017
2016
2015
- NPD 2015 sales figures
|
|
2014
- NPD 2014 sales figures
|
|
2013
- NPD 2013 sales figures
|
2012
2011
|
|
2010
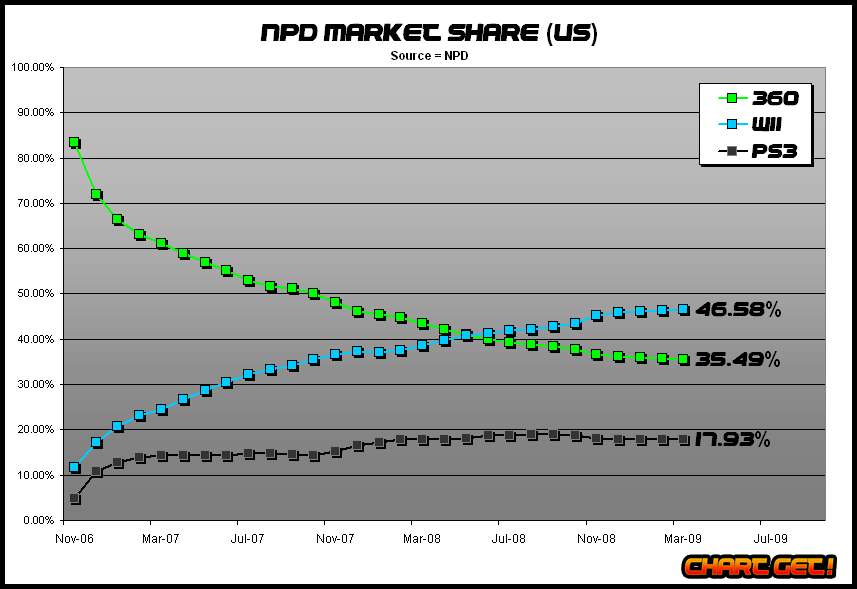  NPD Seventh generation market share (chart courtesy of Chart Get!) |
  NPD Seventh generation market share (image courtesy of Chart Get!) |
2009
2008
2007
2006
|
2005
2004
2003
2002
- NPD - First quarter of 2002
- NPD June 2002
- NPD July 2002
- NPD August 2002
- NPD September 2002
- NPD October 2002
- NPD November 2002 2
- NPD December 2002
2001
- NPD January - September 2001 (archive)
- "The top five selling videogame software titles sold in the United States for 2001". WIPO Guide on the Licensing of Copyright and Related Rights. World Intellectual Property Organization (WIPO). 2004. p. 72. https://www.wipo.int/edocs/pubdocs/en/copyright/897/wipo_pub_897.pdf#page=73.
- NPD Group (February 7, 2002). "NPD REPORTS ANNUAL 2001 U.S. INTERACTIVE ENTERTAINMENT SALES SHATTER INDUSTRY RECORD". Press release. http://www.npd.com/dynamic/releases/press_020207.htm. Retrieved January 27, 2015.
- Schilling, Melissa (January 2005). "Game Not Over: Competitive Dynamics in the Video Game Industry". In Lampel, Joseph; Shamsie, Jamal; Lant, Theresa K.. The Business of Culture: Strategic Perspectives on Entertainment and Media. Lawrence Erlbaum Associates. pp. 75–103. https://www.researchgate.net/publication/298787146.
2000
- NPD October 2000 (page 1, page 2, page 3)
- NPD December 2000 (archive)
- "TRST: Top Selling Games of 2000", IGN, 19 January 2001, https://www.ign.com/articles/2001/01/19/trst-top-selling-games-of-2000, retrieved 2021-10-30
- "The Best-Selling Games of 2000". GameSpot. January 16, 2001. https://www.gamespot.com/articles/the-best-selling-games-of-2000/1100-2674371/.
- Schilling, Melissa (January 2005). "Game Not Over: Competitive Dynamics in the Video Game Industry". In Lampel, Joseph; Shamsie, Jamal; Lant, Theresa K.. The Business of Culture: Strategic Perspectives on Entertainment and Media. Lawrence Erlbaum Associates. pp. 75–103. https://www.researchgate.net/publication/298787146.
1999
- "Nintendo Dominates Videogame Sales: A small crop of N64 games followed the pace set by Game Boy titles". IGN. January 13, 2000. Archived from the original on 2002-08-12. https://web.archive.org/web/20020812205849/http://ign64.ign.com/articles/073/073963p1.html.
- "Top-Selling Video Games, 1999". The World Almanac and Book of Facts, 2001. World Almanac Books. 2000. p. 314. ISBN 0886878624. https://archive.org/details/worldalmanacbook02001wies/page/314. "Source: The NPD TRSTS Video Game Tracking Service, The NPD Group, Inc., Port Washington, NY; ranked by units sold"
- "Final Figures - Want to see how well Nintendo really did this year? Sales rankings don't lie". IGN. 15 January 2000. https://www.ign.com/articles/2000/01/15/final-figures.
- Classic NPD-Age SPECIAL: Jan~Jun '94,'99,'04,'09 FULL Data
1998
- "High Scores: Top Titles in the Game Industry". Feed Magazine. April 22, 1999. Archived from the original on May 8, 1999. https://web.archive.org/web/19990508194727/www.feedmag.com/vgs/data.html.
- "On Top Of Their Game". Supermarket News. 8 February 1999. https://www.supermarketnews.com/archive/top-their-game.
1997
- Top 20 games of 1997
- Famighetti, Robert (1998). "Top-Selling Video Games, 1997". The World Almanac and Book of Facts, 1999. World Almanac Books. p. 188. ISBN 978-0-88687-832-0. https://archive.org/details/worldalmanacbo1999mahw/page/188. "Source: The NPD TRSTS Video Game Tracking Service, The NPD Group, Inc., Port Washington, NY; ranked by units sold"
- "US Sales Top 10 for 1997". IGN. 6 February 1998. https://www.ign.com/articles/1998/02/06/us-sales-top-10-for-1997.
- "The Top 20 Games of the Year". IGN. 30 January 1998. https://www.ign.com/articles/1998/01/30/the-top-20-games-of-the-year.
1996
- Famighetti, Robert (1997). "Top-Selling Video Games, 1996". The World Almanac and Book of Facts 1998. World Almanac Books. p. 259. ISBN 0886878217. https://archive.org/details/worldalmanacbook00slwo/page/259. "Source: The NPD TRSTS Video Game Tracking Service, The NPD Group, Inc., Port Washington, NY; ranked by units sold"
1995
- "Top-Selling Video Games, 1995". The World Almanac and Book of Facts, 1997. World Almanac Books. 1996. p. 293. ISBN 9780886878016. https://archive.org/details/worldalmanacbook1997mahw/page/293. "Source: The NPD TRSTS Video Game Tracking Service, The NPD Group, Inc., Port Washington, NY; ranked by units sold"
- "U.S. Top 20 Best-Selling Games in 1995-1999 ranked on dollar sales". NPD Group. January 17, 2020. https://twitter.com/npdgames/status/1217971911973658625.
- January 1995 *Classic Sales-Age* U.S. TOP40 & HW
- FEBRUARY 1995 *Classic Sales-Age*
- *Classic Sales-Age* MARCH 1995 TOP40 & HW
- Top 10 16-Bit Software Titles NOV'95 (Sega of America)
1994
- Famighetti, Robert, ed. (1995). "Top-Selling Video Games, 1994". The World Almanac and Book of Facts, 1996. World Almanac Books. p. 259. https://archive.org/details/worldalmanac96bk00fami/page/259. "Source: The NPD TRSTS Video Game Tracking Service, The NPD Group, Inc., Port Washington, NY; ranked by units sold"
- Classic NPD-Age SPECIAL: Jan~Jun '94,'99,'04,'09 FULL Data
- January-August 1994. NPD Group (June 2006).
- *Classic Sales-Age* SEPT-1994: TOP40 & HW
- October 1994. NPD Group (July 11, 2006).
- *Classic Sales-Age* NOV-1994: TOP40 & HW
- December 1994 - U.S. Top 40. NPD (August 26, 2006).
- Classic NPD-Age: April Edition 2009, 2004, 1999, 1994 sales data
History of the US video game market
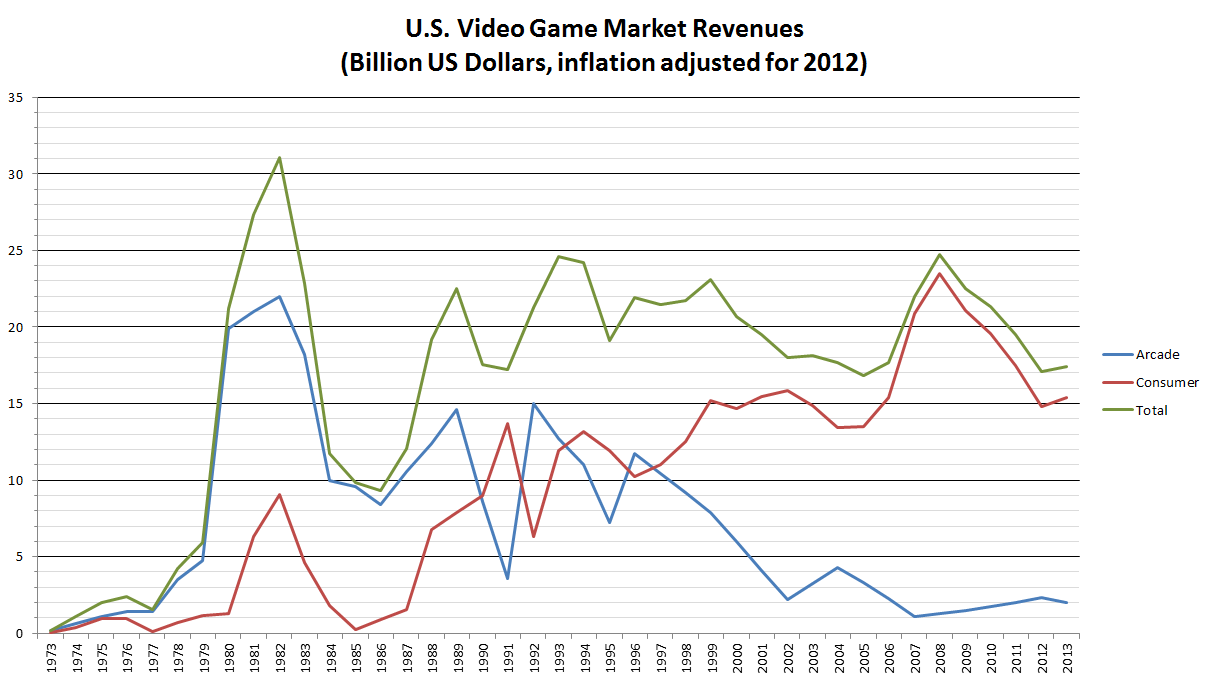
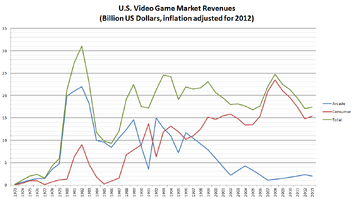
Overall United States video game market revenues from 1973 to 2013, adjusted for inflation (in 2012 dollars for years prior to 2012).
Blue - Arcade sector
Red - Consumer sector (incl. console, PC, handheld, mobile, tablet)
Green - Overall US market (all sectors)
- Main article: Video games in the United States
- See also: Video game industry for worldwide figures and Video games in Japan for Japan figures
Charts
- Main article: Category:Charts
")
")
External links
- See also: List of video game sales websites
- NPD Charts dating back to June 2002 on videobusiness.com
- NPD Charts dating back to July 2004 on gamedaily.com
- Classic NPD-Age SPECIAL: Jan~Jun '94,'99,'04,'09 FULL Data
- NPD: January 2009 Life to Date Numbers (February 27, 2009). Archived from the original on 2009-03-01.
- NPD FLASHBACK: Top 200 best selling PS2/Xbox/GC games end of gen
- Nintendo GBA titles LTD December 2004
- January 2003. The Onion Ring (NPD). Toy Retail Survey Tracking (TRST). Archived from the original on 2003-04-18.
- All Titles Released in 2002. The Onion Ring (NPD). Toy Retail Survey Tracking (TRST) (December 2002). Archived from the original on 2003-02-13.
- THE TOP 100 GAMES OF THE 21st CENTURY (29 July 2006)
- THE CENTURY'S TOP 50 HANDHELD GAMES (2 August 2006)
- Classic NPD-Age: April Edition 2009, 2004, 1999, 1994 sales data
| Video game sales figures | ||
|---|---|---|
| NPD sales figures (U.S.) · Media Create sales figures (Japan) · Chart-Track sales figures (Europe) · PC sales figures | ||