Pokémon is a media franchise owned by Nintendo, created in 1995 and debuted in 1996. It is the highest-grossing entertainment media franchise of all time, having grossed more than $70 billion in revenue, surpassing Star Wars.
In terms of software sales, Pokemon is the second best-selling game franchise, having sold over 295.44 million software units as of March 2017,[n 1] behind only Mario. In addition, Pokemon Go is the most-downloaded mobile game, with 752 million downloads.[3] Pokémon Trading Card Game has also sold over 23.6 billion cards,[4] making it the second best-selling trading card game, after Yu-Gi-Oh![5]
Sales figures
Releases with more than one million sold units:
Main series
| Year | Platform | Titles | Sales (millions) |
Ref | Gross (million US$) (no inflation) |
Ref | Gross (million US$) (with inflation) |
|---|---|---|---|---|---|---|---|
| 1996 | First generation | 59.52 | 2384 | 4448 | |||
| 1996 | GB | Pokémon Red/Green/Blue | 31.38 | [6] | 1271 | [n 2] | 2372 |
| 1998 | GB | Pokémon Yellow | 14.64 | [6] | 454 | [n 3] | 815 |
| 2004 | GBA | Pokémon FireRed & LeafGreen | 12 | [6] | 640 | [n 4] | 992 |
| 2016 | 3DS (VC) | Pokémon Red/Green/Blue/Yellow | 1.5 | [7] | 19 | [n 5] | 19 |
| 1999 | Second generation | 42.21 | 1990 | 3496 | |||
| 1999 | GBC | Pokémon Gold & Silver | 23.1 | [6] | 1016 | [n 6] | 1785 |
| 2000 | GBC | Pokémon Crystal | 6.39 | [6] | 211 | [n 7] | 359 |
| 2009 | DS | Pokémon HeartGold & SoulSilver | 12.72 | [8] | 763 | [n 8] | 1041 |
| 2002 | Third generation | 36.33 | 1648 | 2681 | |||
| 2002 | GBA | Pokémon Ruby & Sapphire | 16.22 | [6] | 689 | [n 9] | 1121 |
| 2004 | GBA | Pokémon Emerald | 6.32 | [6] | 256 | [n 10] | 397 |
| 2014 | 3DS | Pokémon Omega Ruby & Alpha Sapphire | 13.79 | [2] | 703 | [n 11] | 869 |
| 2006 | Fourth generation | 25.27 | 1150 | 1669 | |||
| 2006 | DS | Pokémon Diamond & Pearl | 17.67 | [8] | 778 | [n 12] | 1130 |
| 2008 | DS | Pokémon Platinum | 7.6 | [6] | 372 | [n 13] | 506 |
| 2010 | Fifth generation | 24.16 | 1194 | 1602 | |||
| 2010 | DS | Pokémon Black and White | 15.64 | [8] | 759 | [n 14] | 1019 |
| 2012 | DS | Pokémon Black 2 and White 2 | 8.52 | [6] | 435 | [n 15] | 554 |
| 2013 | Sixth generation | 16.15 | 953 | 1197 | |||
| 2013 | 3DS | Pokémon X and Y | 16.15 | [2] | 953 | [n 16] | 1197 |
| 2016 | Seventh generation | 15.67 | 838 | 838 | |||
| 2016 | 3DS | Pokémon Sun and Moon | 15.67 | [2] | 838 | [n 17] | 826 |
| Main series total | 219.26 | 10157 | 18952 |
Spinoffs
| Year | Platform | Title | Sales (millions) |
Ref |
|---|---|---|---|---|
| 1999 | Pokémon Pinball series | 6.68 | ||
| 1999 | GB | Pokémon Pinball | 5.31 | [6] |
| 2003 | GBA | Pokémon Pinball: Ruby & Sapphire | 1.37 | [6] |
| 1999 | Pokémon Stadium series | 9.95 | ||
| 1999 | N64 | Pokémon Stadium | 5.46 | [6] |
| 2000 | N64 | Pokémon Stadium 2 | 2.54 | [6] |
| 2006 | Wii | Pokémon Battle Revolution | 1.95 | [6] |
| 2003 | Pokémon Colosseum series | 3.78 | ||
| 2003 | GC | Pokémon Colosseum | 2.41 | [6] |
| 2005 | GC | Pokémon XD: Gale of Darkness | 1.37 | [6] |
| 2005 | Pokémon Mystery Dungeon series | 14.76 | ||
| 2005 | GBA | Pokémon Mystery Dungeon: Red Rescue Team | 2.36 | [6] |
| 2005 | DS | Pokémon Mystery Dungeon: Blue Rescue Team | 3.49 | [6] |
| 2007 | DS | Pokémon Mystery Dungeon: Explorers of Time Pokémon Mystery Dungeon: Explorers of Darkness |
4.88 | [6] |
| 2009 | DS | Pokémon Mystery Dungeon: Explorers of Sky | 1.49 | [6] |
| 2013 | 3DS | Pokémon Mystery Dungeon: Gates to Infinity | 1.32 | [6] |
| 2015 | 3DS | Super Pokémon Mystery Dungeon | 1.22 | [11] |
| 2006 | Pokémon Ranger series | 6.81 | ||
| 2006 | DS | Pokémon Ranger | 2.93 | [6] |
| 2008 | DS | Pokémon Ranger: Shadows of Almia | 2.35 | [6] |
| 2010 | DS | Pokémon Ranger: Guardian Signs | 1.53 | [6] |
| Other games | ||||
| 1998 | GB | Pokémon Trading Card Game | 3.7 | [6] |
| 1999 | N64 | Pokémon Snap | 3.63 | [6] |
| 2010 | Wii | PokéPark Wii: Pikachu's Adventure | 1.25 | [6] |
| 2011 | 3DS | Pokémon Rumble Blast | 1.38 | [6] |
| 2016 | Wii U | Pokkén Tournament | 1 | [12] |
Mobile
| Year | Platform | Title | Downloads (millions) |
Revenue (million US$) |
Ref |
|---|---|---|---|---|---|
| 2016 | iOS Android |
Pokémon Go | 752 | 1200 | [3][13][14][15] |
Franchise gross
Table
| Date | Gross revenue | Ref | ||
|---|---|---|---|---|
| Trillion JP¥ (no inflation) |
Billion US$ (no inflation) |
Billion US$ (with inflation) | ||
| 1997 | 4 | 7 | [n 18] | |
| 1998 | 7.3 | 13 | [n 19] | |
| 1999 | 11 | 19 | [n 20] | |
| 2001 | 2 | 17 | 28 | [n 21] |
| 2002 | 3 | 26.1 | 42 | [n 22] |
| March 2013 | 4 | 37 | 60 | [n 23] |
| March 2015 | 4.4 | 41 | 65.1 | [n 24] |
| September 2015 | 4.6 | 57 | 67.12 | [n 25] |
| May 2016 | 4.8 | 64.4 | 75 | [n 26] |
| March 2017 | 6 | 75.43 | 86.03 | [n 27] |
History
By June 1998, the Pokémon franchise was worth $4 billion in Japan.[16] By March 1999, Pokémon was generating revenues of nearly ¥400 billion ($3.28 billion) annually.[17] In Japan, the franchise earned ¥1 trillion by 2002, including ¥98 billion from Japanese software sales.[28]
Worldwide, the franchise earned ¥2 trillion by 2001.[18] By 2002, the franchise had earned ¥3 trillion,[20] including $15 billion from merchandise sales worldwide,[29] while the rest were earned from video games, anime, and trading cards. In 2005, a theme park was opened in Nagoya, Japan.[30] By 2013, the Pokemon franchise had earned ¥4 trillion in revenue.[22]
As of March 2017, the Pokémon franchise has grossed ¥6 trillion ($75 billion) in revenue. ¥78.87 billion ($739 million) was grossed from Pokémon films, which were seen by 74.33 million moviegoers, while the rest of the earnings were from the video games, trading card game, anime TV show, and licensed products.[4] This makes Pokémon the highest-grossing entertainment media franchise of all time, ahead of Star Wars ($42 billion), Harry Potter ($25 billion), James Bond ($6 billion), and The Lord of the Rings ($6 billion).[31]
Generations
First generation
The first generation of Pokemon consists of the worldwide Editions Pokemon Red, Blue and Yellow and Pokemon Green which was only sold in Japan. They sold 47.52 million units on the Game Boy and Virtual Console.
FireRed and LeafGreen are first generation remakes. They sold 12 million units on the Game Boy Advance.
Second generation
The second generation consists of Pokemon Gold, Silver and Crystal. They sold 29.49 million units on the Game Boy Color.
HeartGold and SoulSilver are second generation remakes. They sold 12.72 million units on the Nintendo DS.
Third generation
The third generation consists of Pokemon Ruby, Sapphire, and Emerald. They sold 22.54 million units on the Game Boy Advance.
Omega Ruby & Alpha Sapphire, a remake of the third generation for the Nintendo 3DS, was successful. Pre-orders were ahead of X & Y and launch sales have been good. In America, the game has sold 2.6 million with versions combined as of the end of December and 2.9 million by the end of February. It sold 476,000 in France by the end of December 2014.[32]. In Japan, it sold 2.5 million by the end of 2014. They exceeded 10 million by September 2015. In May 2016, the game exceeded 3 million in Europe. They sold 13.68 million units in total.
Fourth generation
The fourth generation consists of Pokemon Diamond, Pearl and Platinum, with 25.24 million sold units.
Fifth generation
The fifth generation consists of two versions of each Pokemon Black and White, with 24.14 million sold units.
Sixth generation
The sixth generation consists of Pokemon X and Y, with 16.06 million sold units. In Japan, it has sold about 4.5 million.
Pokemon Go is based off this generation and has broken most records in relation to mobile charts, including being #1 in top grossing in the most countries as well as the fastest to hit $600 million in revenue.[33]
Seventh generation
The seventh generation consists of Pokemon Sun and Moon. Due to the preceding hype built by a Superbowl Commercial, re-releases of the original games on digital storefronts, and Pokemon Go, it surpassed Omega Ruby and Alpha Sapphire as Nintendo's most preordered game. In November 2016, the games have sold 3.7 million in the Americas and 1.5 million in Europe, becoming Nintendo's fastest seller titles ever. If Japanese numbers, the games sold about 7.5 million copies in 2 weeks. In the United States, by December 2016, the game had sold 4.5 million copies, making it the fastest Nintendo game to reach 4 million. As of December 31, 2016, the game has shipped 14.69 million copies, already outselling Omega Ruby and Alpha Sapphire.
Demographics
The regional breakdown of Pokemon franchise revenues:[4]
- Japan: 35%
- Overseas: 65%
The demographic breakdown of Pokemon Go users:[34]
- Gender:
- Female: 63%
- Male: 37%
- Age:
- 13-17: 22%
- 18-29: 46%
- 30-50: 25%
- Over 50: 6%
- Income:
- Under $50K: 45.8%
- $50K to $100K: 19.6%
- Over $100K: 34.6%
- Region:
- Urban: 90%
- Rural: 10%
Notes
- ↑ Pokémon:
- ↑ Average Pokémon Red/Green/Blue price: $40.50
- ↑ Average Pokémon Yellow price: $31
- ↑ Average Pokémon FireRed & LeafGreen price: $53.33
- ↑ Average Pokémon Red/Green/Blue/Yellow (Virtual Console) price: $12.50
- ↑ Average Pokémon Gold & Silver price: $44
- ↑ Average Pokémon Gold & Silver price: $33.05
- Japan: ¥4104 (https://www.ofx.com/en-gb/forex-news/historical-exchange-rates/yearly-average-rates/ $38.10])
- United States: $27.99
- ↑ Average Pokémon HeartGold & SoulSilver price: $60
- ↑ Average Pokémon Ruby & Sapphire price: $42.50
- ↑ Average Pokémon Emerald price: $40.50
- ↑ Average Pokémon Omega Ruby & Alpha Sapphire price: $51
- ↑ Pokémon Diamond & Pearl:
- ↑ Average Pokémon Platinum price: $49
- ↑ Average Pokémon Black & White price: $48.50
- ↑ Average Pokémon Black 2 & White 2 price: $51
- ↑ Average Pokémon X & Y price: $59
- ↑ Average Pokémon Sun & Moon price: $53.50
- ↑ Japan gross up until 1997[16]
- ↑ Worldwide gross in 1998: $3.28 billion[17]
- ↑ Worldwide gross in 1999: $3.28 billion[17]
- ↑ Worldwide gross up until 2001: ¥2 trillion[18]
- Currency conversion: $17 billion[19]
- ↑ Worldwide gross up until 2002: ¥3 trillion[20]
- Currency conversion: $26.1 billion[21]
- ↑ Worldwide gross up until March 2013: ¥4 trillion[22] ($37 billion, or $60 billion with inflation)
- Gross up until 2002: ¥3 trillion ($26.1 billion, or $42 billion with inflation)
- Additional gross up until March 2013: ¥1 trillion ($23.9 billion, or $30 billion with inflation)
- ↑ Worldwide gross up until March 2015: ¥4.4 trillion[23] ($41 billion, or $65.1 billion with inflation)
- Gross up until March 2013: ¥4 trillion ($37 billion, or $60 billion with inflation)
- Gross from April 2013 to March 2015: ¥400 billion ($4 billion, or $4.9 billion with inflation)
- ↑ Worldwide gross up until September 2015: ¥4.6 trillion[24] ($57 billion, or $67.12 billion with inflation)
- Gross up until March 2015: ¥4.4 trillion ($41 billion, or $65.1 billion with inflation)
- Gross during April-September 2015: ¥200 billion ($2 billion,[25] or $2.47 billion with inflation)
- ↑ Worldwide gross up until May 2016: ¥4.8 trillion[26] ($64.4 billion, or $75 billion with inflation)
- Gross up until September 2015: ¥4.6 trillion ($57 billion, or $67.12 billion with inflation)
- Gross from April 2013 to May 2016: ¥800 billion ($7.4 billion)[27]
- ↑ Worldwide gross up until March 2017: ¥6 trillion[4] ($75.43 billion, or $86.03 billion with inflation)
- Gross up until May 2016: ¥4.8 trillion ($64.4 billion, or $75 billion with inflation)
- Gross from June 2016 to March 2017: ¥1.2 trillion ($11.03 billion)[27]
References
- ↑ https://web.archive.org/web/20160721223226/www.pokemon.co.jp/corporate/en/data/
- ↑ 2.0 2.1 2.2 2.3 http://www.nintendo.co.jp/ir/en/sales/software/3ds.html
- ↑ 3.0 3.1 https://venturebeat.com/2017/06/30/pokemon-go-passes-1-2-billion-in-revenue-and-752-million-downloads/
- ↑ 4.0 4.1 4.2 4.3 Pokémon in Figures. Pokémon Company (March 2017).
- ↑ https://www.konami-digital-entertainment.co.jp/en/news/topics/2011/0614/
- ↑ 6.00 6.01 6.02 6.03 6.04 6.05 6.06 6.07 6.08 6.09 6.10 6.11 6.12 6.13 6.14 6.15 6.16 6.17 6.18 6.19 6.20 6.21 6.22 6.23 6.24 6.25 6.26 6.27 Nintendo software and hardware sales data from 1983 to present, December 2014
- ↑ Financial Results Briefing for Fiscal Year Ended March 2016. Nintendo (April 28, 2016). Retrieved on May 1, 2016.
- ↑ 8.0 8.1 8.2 IR Information : Sales Data - Top Selling Software Sales Units - Nintendo DS Software
- ↑ Famitsu: Japan's 21st Century Top 100 Selling Games
- ↑ http://www.the-magicbox.com/Chart-USPlatinum.shtml
- ↑ https://www.nintendo.co.jp/ir/pdf/2016/160427_4e.pdf
- ↑ http://www.siliconera.com/2016/08/18/pokkn-tournament-surpasses-one-million-worldwide-shipments
- ↑ http://www.kotaku.com.au/2016/11/pokemon-go-hits-600-million-downloads/
- ↑ https://techcrunch.com/2017/02/01/report-pokemon-go-has-now-crossed-1-billion-in-revenue/
- ↑ http://venturebeat.com/2017/01/17/pokemon-go-generated-revenues-of-950-million-in-2016/
- ↑ 16.0 16.1 http://cjonline.com/stories/082798/com_pokemon0827.shtml
- ↑ 17.0 17.1 17.2 http://thegia.com/archive/news/n990603a.html
- ↑ 18.0 18.1 http://www.iist.or.jp/wf/magazine/0196/0196_E.html
- ↑ 121 JPY per USD in 2001
- ↑ 20.0 20.1 Japanese Pop Industry (MIT)
- ↑ 115 JPY per USD in 2003
- ↑ 22.0 22.1 "Pokemon X · Y" is released on October 12, 2013, Famitsu
- ↑ https://web.archive.org/web/20151205162239/www.pokemon.co.jp/corporate/en/data/
- ↑ https://web.archive.org/web/20160628041935/www.pokemon.co.jp/corporate/en/data/
- ↑ 121 JPY per USD in 2015
- ↑ https://web.archive.org/web/20160721223226/www.pokemon.co.jp/corporate/en/data/
- ↑ 27.0 27.1 108.8 JPY per USD in 2016
- ↑ http://academic.csuohio.edu/makelaa/history/courses/his373/The%20Japan%20Times%20Online.htm
- ↑ http://archive.wired.com/wired/archive/9.09/topten_pr.html
- ↑ http://archive.li/4d5Jq
- ↑ Chew, Jonathan (December 24, 2015). Star Wars Franchise Worth More Than Harry Potter and James Bond, Combined. Fortune. Retrieved on November 29, 2016.
- ↑ http://www.lefigaro.fr/secteur/high-tech/2015/01/22/01007-20150122ARTFIG00382-nintendo-premier-vendeur-de-jeux-video-en-france.php
- ↑ http://venturebeat.com/2016/10/20/pokemon-go-is-the-fastest-mobile-game-to-hit-600-million-in-revenues/
- ↑ https://www.forbes.com/sites/ryanmac/2016/07/26/more-women-than-men-are-playing-pokemon-go-by-a-lot/
| Best selling franchises | |
|---|---|
| Mario · Pokémon · FIFA · Grand Theft Auto · Call of Duty · Wii Series · Lego · The Sims · Minecraft · Final Fantasy · Assassin's Creed · Need for Speed · Sonic · Madden NFL · The Legend of Zelda · Star Wars · Resident Evil · Pro Evolution Soccer · Tetris · NBA 2K · (more) See also: Best selling games · Best selling games worldwide · Highest grossing franchises |
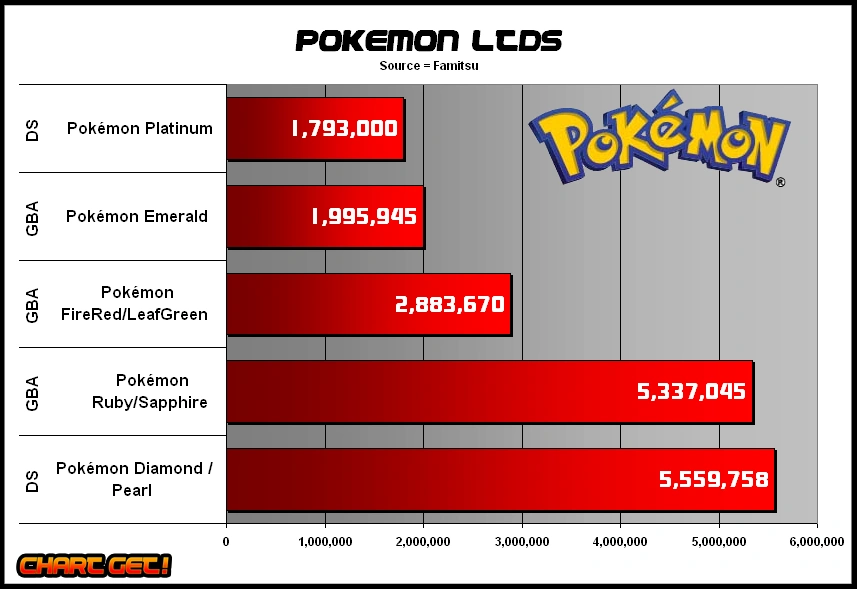
Famitsu Japan sales through October 2008 (courtesy Chart Get!)